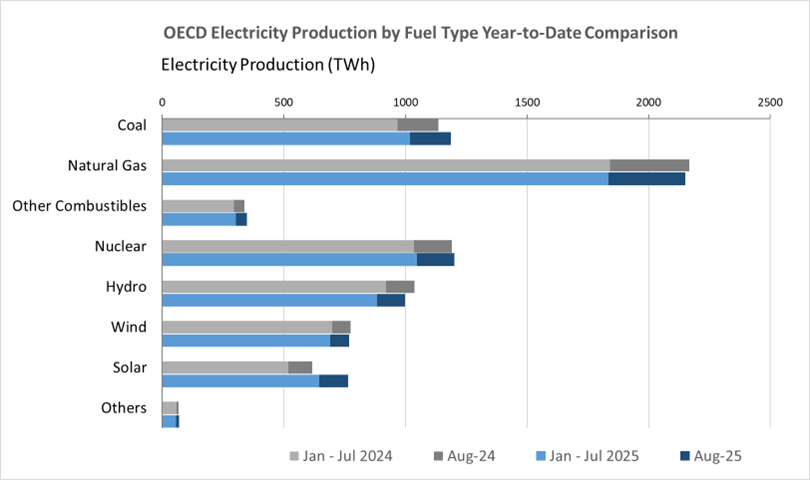
In August 2025, total net electricity generation in the OECD reached 990.5 TWh, a decrease of 0.2% compared with August 2024. Of this total, 499.1 TWh (50.4%) was produced from fossil fuels, 336.6 TWh (34.0%) from renewable sources and 150.4 TWh (15.2%) from nuclear power.
Electricity generation from fossil fuels decreased by 2.2% (-11.5 TWh) year-on-year in the OECD in August 2025, mainly due to lower electricity generation from natural gas, which fell by 3.2% year-on-year (-10.5 TWh). The shares of natural gas, coal and oil as a percentage of total electricity generation were 31.8%, 16.8% and 1.2%, respectively. The decline in electricity generation from natural gas was driven primarily by the United States (-4.9% y-o-y, -9.7 TWh), Korea (-12.0% y-o-y, -1.9 TWh) and Italy (-19.1%, -1.9TWh).
Electricity generation from
renewable sources in the OECD increased by 4.3%
year-on-year (+13.8 TWh) in August 2025. The highest absolute increase came from solar power, which grew by 20.1% y-o-y (+19.8 TWh), bringing total OECD solar generation to 118.2 TWh (11.6% of total generation). The strongest year-on-year growth was in the OECD Americas, where solar power generation increased by 27.6% year-on-year (+10.0 TWh) to 46.4 TWh. Conversely, hydropower generation in the OECD decreased by 5.4% year-on-year (-6.3 TWh) to 111.9 TWh (11.3% of total generation), with the OECD Americas witnessing a 5.7% year-on-year decrease (-3.5 TWh), followed by OECD Europe with a 4.5% decline (-2.1 TWh). Electricity generation from wind remained stable (+0.1% y-o-y) within the OECD in August 2025.
Nuclear power generation in the OECD declined by 2.9% year-on-year (-4.5 TWh) in August 2025. Output in the OECD Americas remained unchanged compared with the previous year, while OECD Europe and OECD Asia Oceania recorded decreases of 8.1% (-4.5 TWh) and 1.7% (-0.3 TWh) year-on-year, respectively.