The IEA is delighted to inform all data users of the upcoming update of the
Weather for Energy Tracker, with data up to 2025. It will feature a new revamped data repository.
The IEA and CMCC Weather for Energy Tracker is a free platform showcasing weather-related data useful to understand, analyse and model the energy sector, from generation to use across sectors. Data is available at the grid, country and sub-national levels, with a daily and monthly resolution from 1979 to the latest available month, and including monthly climatologies and anomalies.
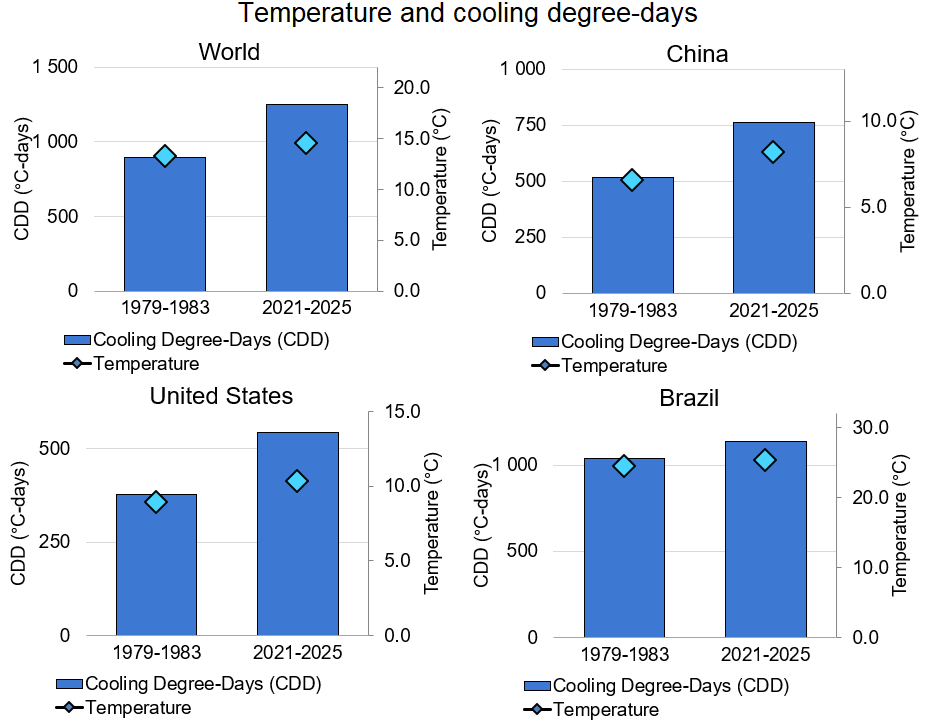
The year 2025 was the third warmest globally, both in terms of average temperature and cooling degree-days (CDD) – a key driver for cooling energy demand. CDDs have increased at around 0.8% per year on average, significantly more than the 0.3% rate of global temperatures, as illustrated below for a few countries and regions.